MANNIN SYSTEMS

Mannin Systems / Free templates

Free OEE calculator and downtime tracker for Excel

Work out OEE for every machine and shift from three numbers you already know, and total your downtime by reason so you can see which stops cost you most.

For any factory. No sign-up and no email address needed. Works in Excel, Google Sheets and LibreOffice.

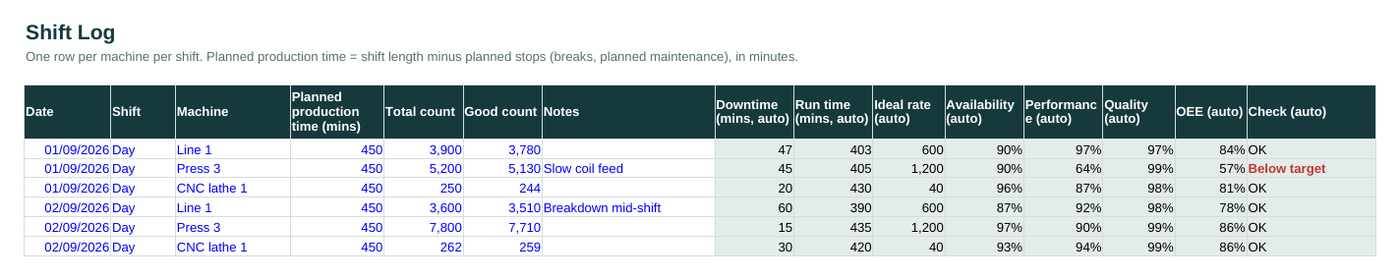
The Shift Log tab of the free oee and downtime tracker template, filled in with example data
The Shift Log tab, with the example data it comes with. Blue cells are for typing; grey cells calculate.

What’s inside

Start Here
What it does, how to use it, and the key to which cells to type in.
Shift Log
One row per machine per shift. Downtime, run time, availability, performance, quality and OEE all calculate automatically.
Summary
OEE by machine across everything logged, and downtime by reason, ranked and charted.
Machines
Each machine or line, what it counts (parts, metres or kilos) and its ideal rate per hour.
Reasons
Your short list of downtime reasons, each with a category.
Downtime Log
Every stop: date, shift, machine, minutes lost and reason.

How to use it

  1. List your machines with the ideal rate each can run at, per hour.

  2. Keep a short list of downtime reasons, each in a category.

  3. Log each stop as it happens in the Downtime Log.

  4. At the end of each shift, enter the planned production time and the total and good counts. OEE appears straight away.

How OEE is calculated

OEE, overall equipment effectiveness, is three percentages multiplied together:

OEE = availability × performance × quality

  • Availability: run time ÷ planned production time. It’s what downtime costs you.
  • Performance: what you made ÷ what you could have made at the ideal rate in the run time. It’s what running slow costs you.
  • Quality: good count ÷ total count. It’s what scrap costs you.

Worked example from the template: Line 1 had 450 minutes of planned production and lost 47 minutes to a die change and a jam, so it ran for 403 minutes. Availability 89.6%.

At its ideal 600 metres an hour it could have made 4,030 m; it made 3,900 m. Performance 96.8%.

3,780 m of the 3,900 m were good. Quality 96.9%. OEE = 89.6% × 96.8% × 96.9% = 84%.

Getting honest numbers

  • Planned production time is the shift minus planned stops such as breaks and planned maintenance. Everything else that stops the machine is downtime.
  • Use the ideal rate, not the average. If you use the average, performance will always look fine and you’ll never see slow running.
  • Keep the reasons list short. Eight to ten reasons get used properly; forty get ignored.

When the spreadsheet stops being enough

Mannin Systems does all of this as part of the day’s work: booked at the station as it happens, checked automatically, and linked to the jobs, stock and people involved. No retyping, and no Friday afternoon catching up.

See quality checks in the demo

Questions about this template

What is a good OEE score?

85% is often quoted as world class. Many small factories measuring OEE for the first time find they’re somewhere between 40% and 60%, and the value is in improving your own number, not comparing it with others.

Does it work for metres and kilos, not just parts?

Yes. Each machine has its own unit and ideal rate, so an extrusion line in metres and a press in parts can sit side by side.

Should breaks count as downtime?

No. Take planned stops out of the planned production time instead, so availability only reflects unplanned stops.

Does it work in Google Sheets?

Yes. Upload it to Google Drive and open it with Google Sheets. It also works in Excel and LibreOffice.

Tell us what you're running on now

A few lines about what you make and how you plan production today is plenty to start with, or simply ask for an introductory call. You'll get a personal reply.